Home › Blog › Guwahati Airport Passenger Traffic: Latest Figures
Guwahati Airport Passenger Traffic: Latest Figures
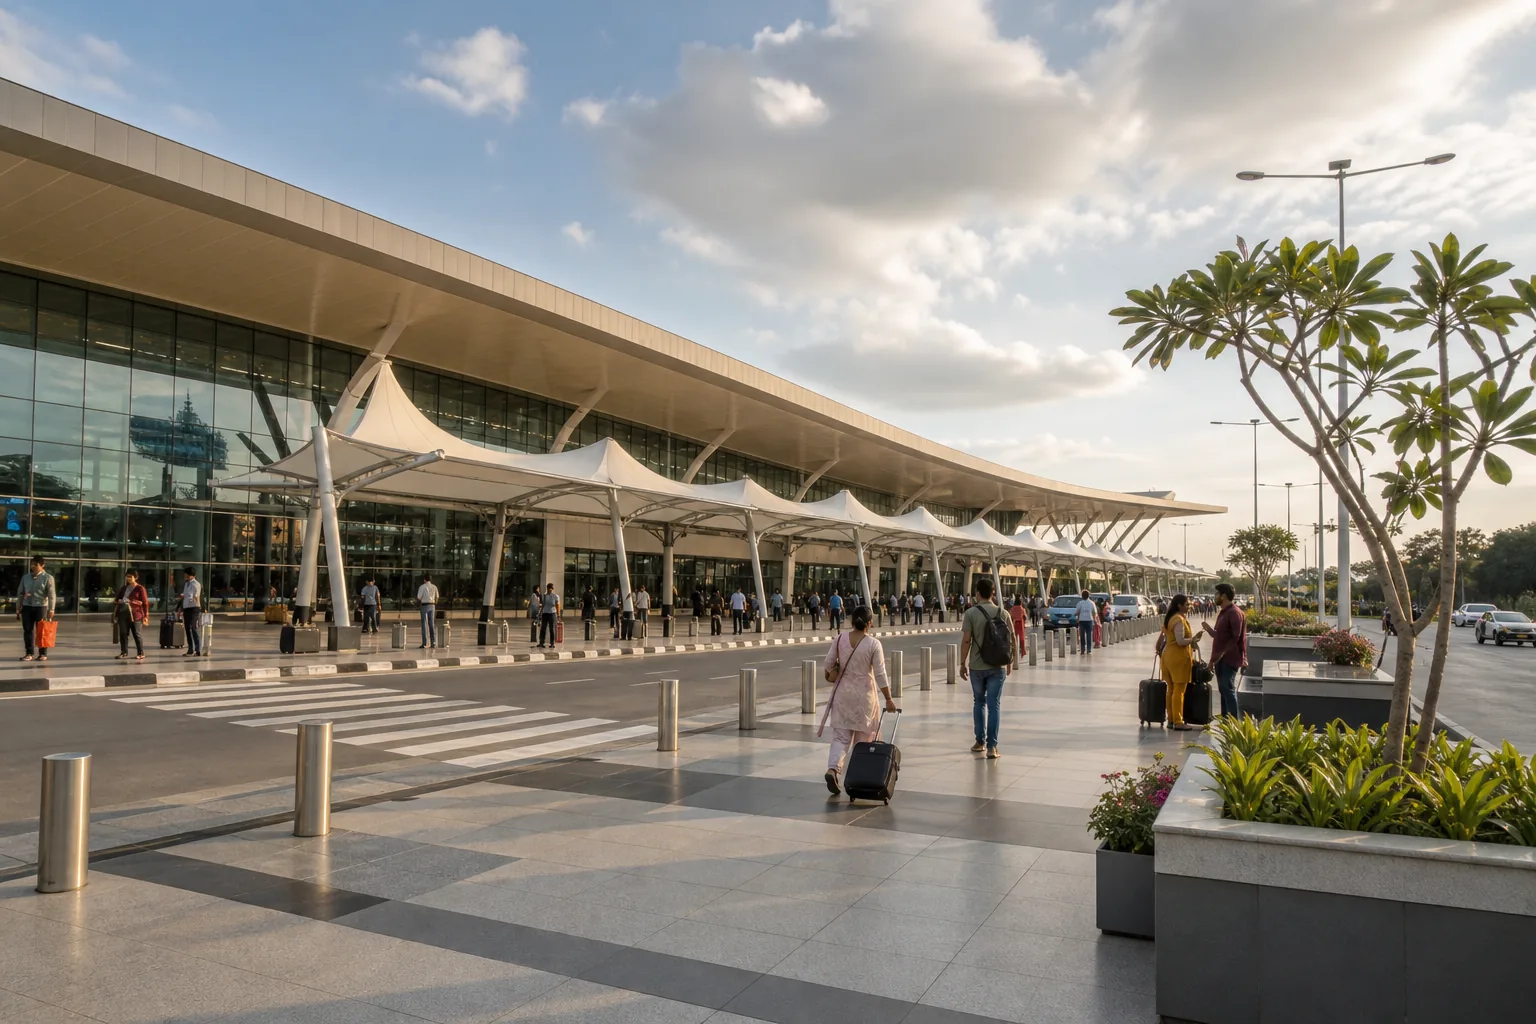
Guwahati Airport handled about 7.01 million passengers in 2025, a new high in the reported annual figures. These Guwahati Airport passenger traffic statistics need one key distinction: calendar-year totals and financial-year totals cover different periods, so they shouldn’t be compared as if they were the same measure.
The Latest Official Passenger Traffic Figures
The reported total for calendar year 2025 was approximately 7.01 million passengers. That figure counts people arriving and departing, not unique individuals. A traveller who flies into Guwahati and later flies out contributes to both movements.
A separate aviation report puts traffic at about 6.57 million for financial year 2024-25. That is a different reporting period from the 2025 calendar-year figure. Treat the two as separate records, not as a direct year-on-year comparison.
Historical figures include more than 3.7 million passengers in 2017 and 5.7 million in 2018-19. More than 5.6 million were reported in 2023. These figures show how passenger volumes have grown over time, though they don’t all use the same period length.
For 2025, the reported domestic total was about 6.9 million. International traffic was 90,897 passengers, while cargo handled was 32,990 tonnes. Domestic travel therefore made up more than 98% of the reported passenger total. Cargo is a separate measure, so it shouldn’t be added to passenger counts.
The figures are useful for seeing the scale of traffic. But they don’t tell you how many people were in the terminal at a particular hour, which flight banks were busiest, or how long a queue took to clear.
For the reported financial-year figure, an aviation report on Guwahati Airport’s Terminal 2 gives an estimate of 6.57 million passengers in 2024-25. It’s best to retain the report’s period label when using that number.
Passenger Traffic Trends Over Time
The broad trend is upward. The reported total rose from more than 3.7 million in 2017 to 5.7 million in 2018-19. The airport then handled more than 5.6 million passengers in 2023, followed by a reported 7.01 million in calendar year 2025.
Growth rates are available for only some entries in this set. Those percentages describe different years and shouldn’t be presented as a single recent growth rate.
| Reporting period | Reported passenger total | How to read it |
|---|---|---|
| 2017 | More than 3.7 million | Reported with 36% year-on-year growth |
| 2018-19 | 5.7 million | Financial-year total, with growth above 23% |
| 2023 | More than 5.6 million | Reported for the year through 31 December |
| 2025 | Approximately 7.01 million | Calendar-year total; domestic, international and cargo figures are also reported |
The table is a trend guide, not a perfectly matched series. Some totals are tied to a financial year, while others refer to a calendar year or a stated date range. That matters when working out growth. To calculate a fair percentage, compare the same months or the same financial-year span in both periods.
The reported 2025 breakdown also shows why total passengers and traffic mix are different questions. The total suggests the airport handled a larger overall volume. The domestic and international split tells you which kind of passenger movement made up most of that volume. The figures supplied here don’t give matching segment totals for each earlier year, so a year-by-year mix comparison isn’t possible from this set.
Seasonal peaks can affect airport activity, but an annual total can’t show the busiest month or day. For that, travellers need a monthly or daily series that covers the same measure throughout the year. Don’t infer a peak season from a full-year total alone.
How to Read Airport Passenger Statistics
Start with the reporting period. “Calendar year” usually means January through December. “Financial year” means a twelve-month accounting period that crosses two calendar years. A report may also give a partial-year total, such as traffic through a stated date. Check the period before comparing numbers.
Next, check what the word “passengers” counts. Airport traffic totals commonly refer to passenger movements, meaning arrivals and departures are counted separately. They don’t necessarily represent the number of distinct people who used the airport.
Then look at the measure beside the total. Domestic passengers, international passengers and cargo are separate categories. Cargo is usually measured by weight, not by passenger count. A large cargo total doesn’t mean the same thing as a large passenger total.
- Annual total: shows the overall volume for its stated period.
- Year-on-year change: compares a period with the matching period before it.
- Passenger split: separates domestic movement from international movement.
- Cargo volume: records freight handled, usually by weight.
For example, a report saying “more than 1.74 lakh passengers in ten days” describes a short period. It shouldn’t be read as an annual average or compared directly with a full-year total. The dates and the length of the reporting window change what the number can tell you.
Use the same care with growth percentages. A percentage needs a clear base period. If one figure covers a financial year and another covers a calendar year, dividing one by the other can give a misleading result. Missing segment data also limits what you can say about changes in domestic or international travel.
What the Figures Mean for Guwahati Airport Travellers
Higher annual traffic means more people use the airport over the year. It doesn’t guarantee a queue or delay on your travel day. Your own experience depends on your flight time, the number of flights around it and how much time you need for check-in and security.
The airport’s reported capacity of up to 13.1 million passengers a year is a planning figure, not a promise of short queues or a forecast that passenger numbers will reach that level.
Check the relevant instructions before leaving for the airport, especially if your itinerary includes a connection or an international journey.
Most of the reported 2025 passengers were domestic travellers. That underlines the airport’s role in regional travel, but the annual total doesn’t show whether a specific passenger is travelling for work, a family visit or a holiday. The available figures don’t provide a business-versus-leisure profile.
Travellers starting a road journey after landing should allow time to collect bags and arrange onward transport. If you’re planning a park visit, check the route and your next leg in advance, including the Guwahati Airport to Kaziranga distance. The traffic total can give context about the airport’s scale, but it can’t predict road conditions or your transfer time.
A stay close to the airport can help when a late arrival or early departure makes a city-centre night inconvenient. Hotel Shiny Grand is about 1.7 km from LGBI Airport. Direct bookings include one complimentary one-way airport transfer (pickup or drop) and breakfast, served from 7:30 to 10:00 AM. Share flight details when arranging the transfer.
For travellers who need to plan ground transport rather than stay nearby, the Guwahati Airport bus service guide covers route and ticket planning. Check current service details close to your travel date, since an annual passenger figure won’t tell you when a bus departs.

For an overnight stay near LGBI, Hotel Shiny Grand has air-conditioned rooms from ₹2,500 per night, with taxes extra. A direct booking includes free Wi-Fi, parking and breakfast. The hotel’s front desk is staffed 24/7, which can help with late arrivals and early check-outs.
Frequently Asked Questions
How many passengers did Guwahati Airport handle in 2025?
Guwahati Airport handled approximately 7.01 million passengers in calendar year 2025. The same reported breakdown gives about 6.9 million domestic passengers and 90,897 international passengers. These are passenger movements, not necessarily unique people. Keep this calendar-year total separate from financial-year figures.
What was Guwahati Airport’s passenger traffic in financial year 2024-25?
An aviation report gives a figure of about 6.57 million passengers for financial year 2024-25. That period differs from calendar year 2025, which is reported at approximately 7.01 million. Don’t calculate growth by comparing those two totals directly, because their reporting windows don’t match.
What was the passenger growth rate at Guwahati Airport?
A recent growth rate should only be stated when both the current and prior figures cover matching periods and use the same definition.
Does the 2025 passenger total include cargo?
No. The 2025 total of approximately 7.01 million is a passenger figure. Cargo is reported separately, at 32,990 tonnes. Passenger counts and cargo weight use different units, so they can’t be combined into one traffic total.
Does higher annual traffic mean longer airport queues?
Not by itself. An annual total shows the number of passenger movements over a year, but it doesn’t reveal how those passengers were spread across flights or hours. Check your airline’s current instructions and allow enough time for your own journey, especially if you’re checking baggage or connecting to another flight.
Conclusion
Use the 2025 total as a calendar-year snapshot, and check the reporting period before comparing it with any other figure. For an early flight or late arrival, sort out your stay and transfer plan ahead of time. You can check room details and book direct with Hotel Shiny Grand.
For official context, see the Ministry of Tourism, Government of India and the India Brand Equity Foundation. Figures change, so confirm current numbers at the source.